AWS Lambda: An Overview of Observability
Somebody who likes to code
Observability can be challenging in serverless architectures like AWS Lambda. Here is where tools like AWS CloudWatch and AWS X-Ray come in handy, helping us resolve issues quickly and ensuring optimal performance for our serverless functions. These tools offer crucial insights into logs, metrics, and traces, enabling efficient monitoring and troubleshooting in serverless environments.
Monitoring can provide the information you need to help your development and operations teams react to issues. It can help you understand a system’s state using a predefined set of metrics. Observability, on the other hand, uses instrumentation to help provide context and insights to aid monitoring. While monitoring can help you discover that there is an issue, observability can help you discover why.
As observability focuses on understanding data, it begins by collecting data as telemetry. There are three types of telemetry data:
Logs: A log is an immutable, timestamped record of discrete events that happened over time.
Metrics: Metrics are a numeric representation of data measured over time.
Traces: A trace is a representation of a single request across multiple systems.
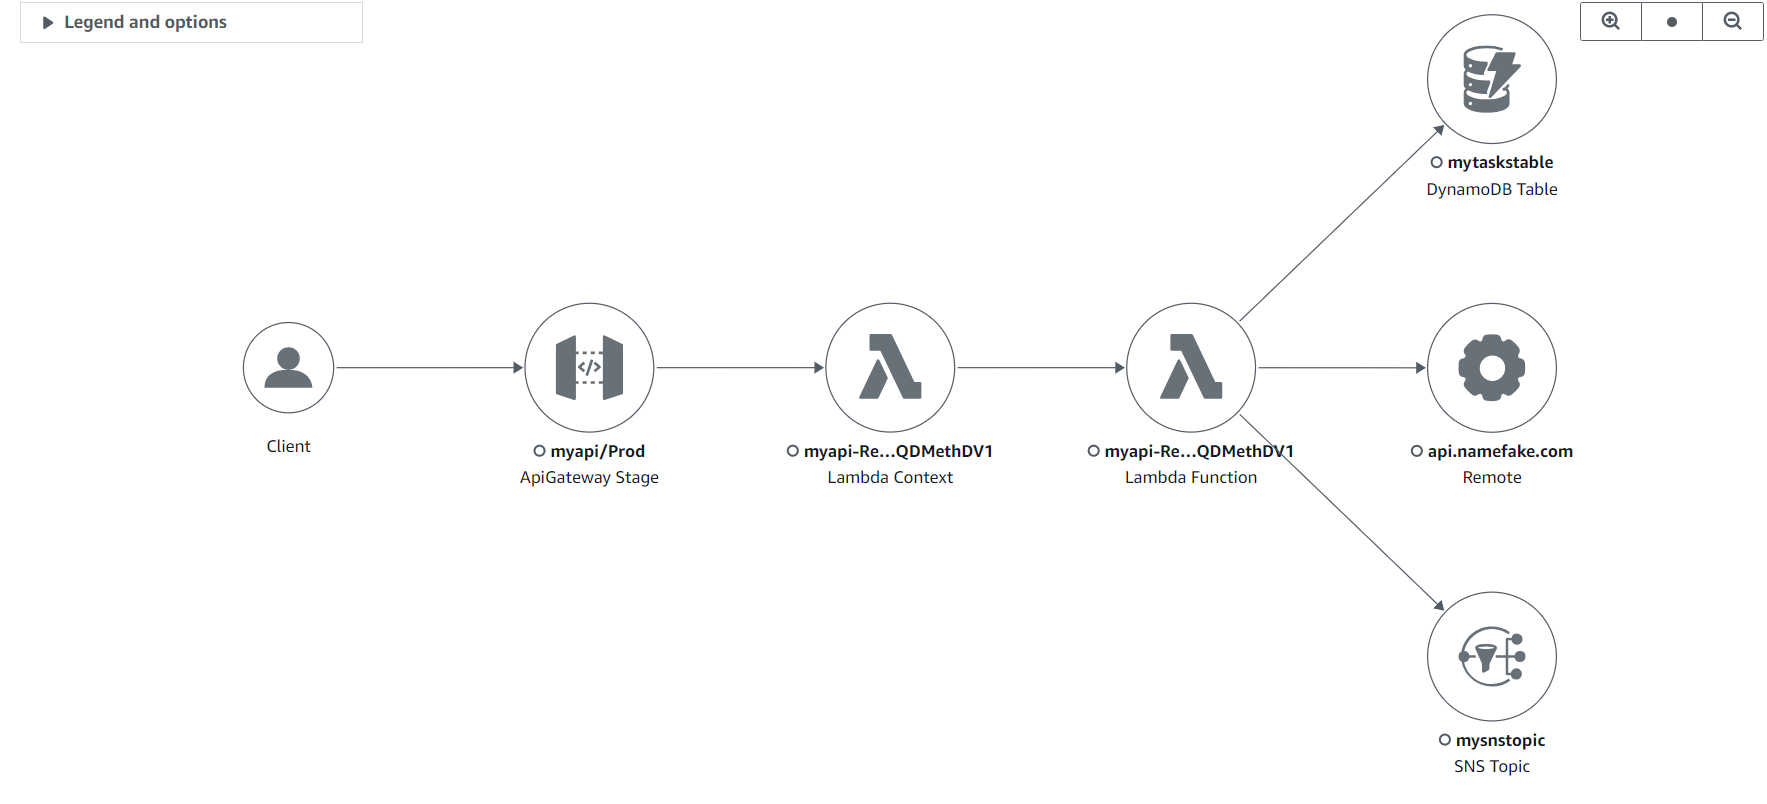
In this article, we will explore how to implement the three pillars of observability in our .NET function using PowerTools for AWS Lambda. Please download the starter code here. The application features an endpoint (POST) for registering a task, which includes:
Retrieving a random worker from an external API.
Print a log.
Storing the task in a DynamoDB table.
Publishing an event to an SNS topic.
Deploy the application using AWS SAM by executing the following commands at the solution level:
sam build
sam deploy --guided
Logging
AWS Lambda automatically streams information about each function invocation, logs, and other output from our code to CloudWatch.
Log groups are a standard part of CloudWatch and are used to organize all logging. Any log generated by a Lambda function uses the naming convention
/aws/lambda/function-name. A log group is a logical collection of log streams, which you can explore in the CloudWatch console. Each instance of a Lambda function has a dedicated log stream.
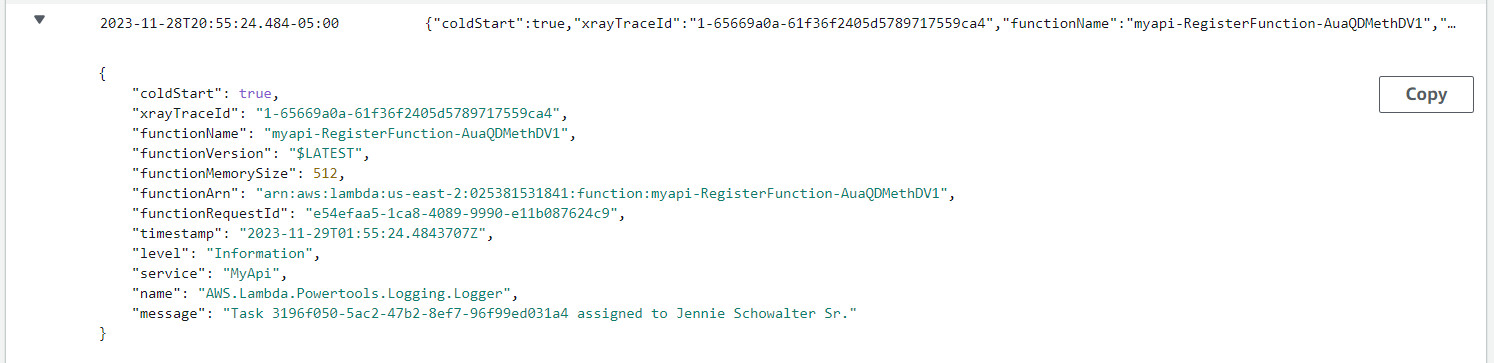
The Lambda function logger, by default, outputs plain text. For instance, the following code:
context.Logger.LogInformation($"Task {taskId} assigned to {worker}");
Generates a log entry similar to:

So, let's run the following command to provide a logger with output structured as JSON:
dotnet add src/MyAPI package AWS.Lambda.Powertools.Logging
Update the Register method in the Function.cs file as follows:
[Logging]
public async Task<APIGatewayHttpApiV2ProxyResponse> Register(APIGatewayHttpApiV2ProxyRequest input, ILambdaContext context)
{
    var request = JsonSerializer.Deserialize<RegisterTaskRequest>(input.Body)!;
    var taskId = Guid.NewGuid();
    var worker = await GetWorker();
    var putItemRequest = new PutItemRequest
    {
        TableName = _tableName,
        Item = new Dictionary<string, AttributeValue> {
                {
                    "id",
                    new AttributeValue {
                    S = taskId.ToString(),
                    }
                },
                {
                    "description",
                    new AttributeValue {
                    S = request.Description
                    }
                },
                {
                    "worker",
                    new AttributeValue {
                    S = worker
                    }
                }
            }
    };
    Logger.LogInformation("Task {TaskId} assigned to {Worker}", new[] { taskId.ToString(), worker });
    await _dynamoDBClient.PutItemAsync(putItemRequest);
    var body = JsonSerializer.Serialize(new RegisterTaskResponse(taskId));
    var @event = new PublishRequest
    {
        TopicArn = _topicArn,
        Message = JsonSerializer.Serialize(new TaskRegistered(taskId, request.Description, worker)),
    };
    await _snsClient.PublishAsync(@event);
    return new APIGatewayHttpApiV2ProxyResponse
    {
        Body = body,
        StatusCode = 200,
        Headers = new Dictionary<string, string> { { "Content-Type", "application/json" } }
    };
}
We decorated the method with the Logging attribute and changed the logging mechanism. Additionally, update the global section of the template.yaml file as follows:
Globals:
  Function:
    Timeout: 30
    MemorySize: 512
    Architectures:
      - x86_64
    Environment:
      Variables:
        POWERTOOLS_SERVICE_NAME: MyApi
        POWERTOOLS_LOG_LEVEL: Information
        POWERTOOLS_LOGGER_CASE: CamelCase
        TABLE_NAME:
          Ref: DynamoTable
        TOPIC_ARN:
          Ref: SNSTopic
        URL: "https://api.namefake.com/"
We are configuring the service name, log level, and casing for log keys. Deploy the application, and the logs will now appear as follows:
For more information, refer to the official documentation here.
Metrics
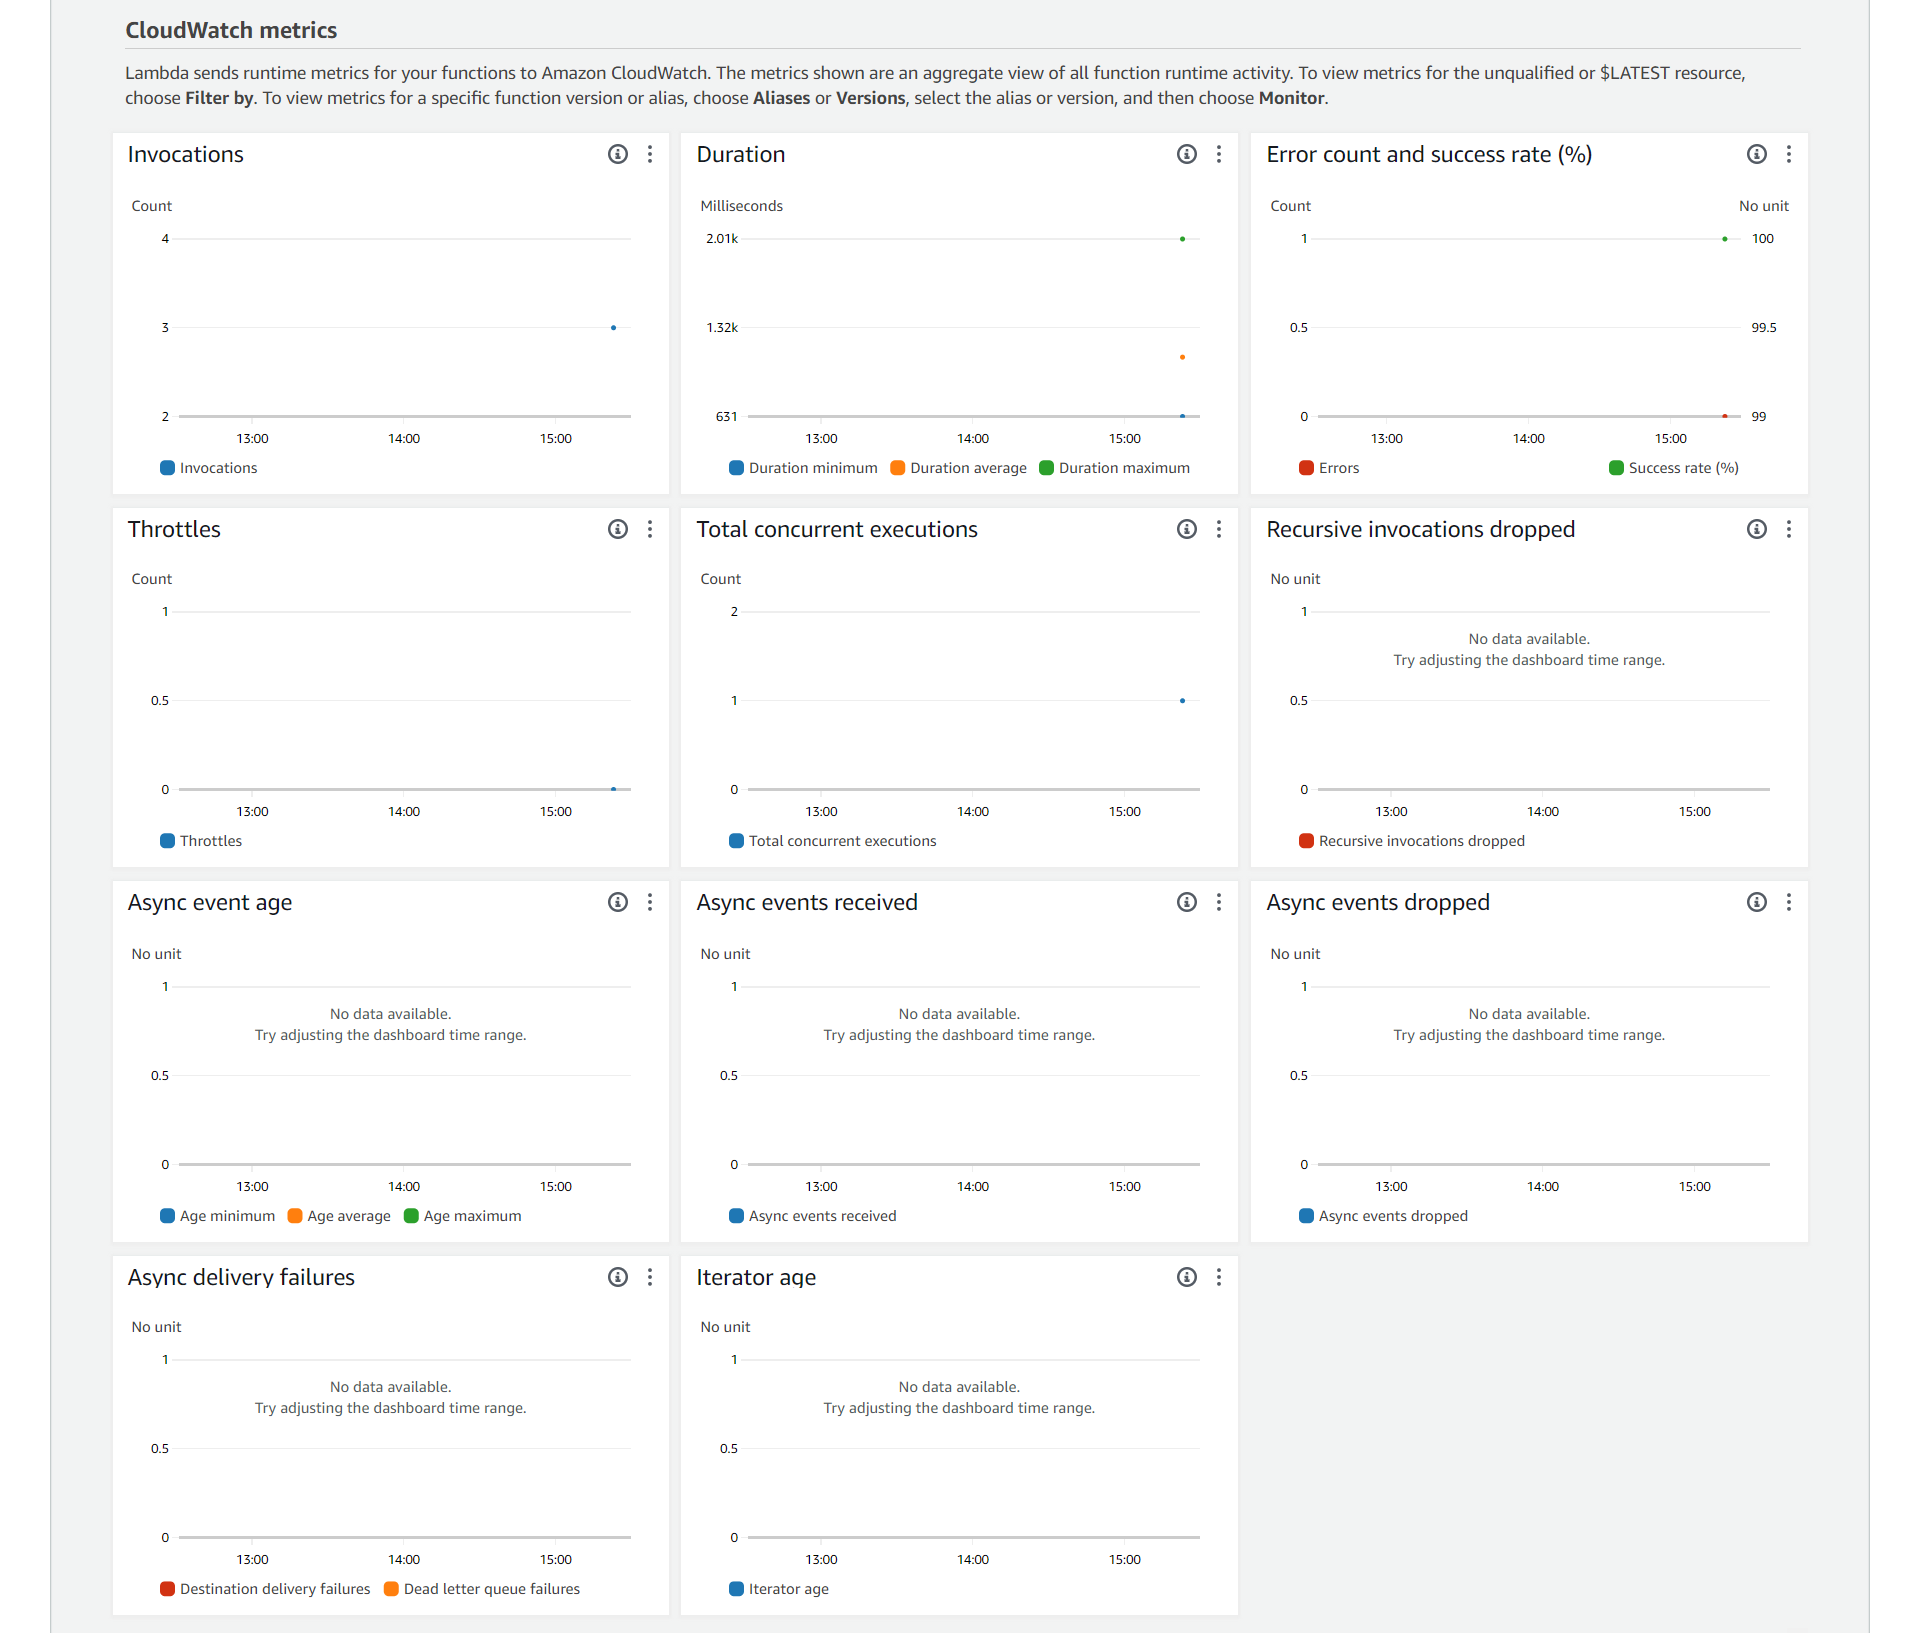
By default, AWS Lambda monitors functions on our behalf, automatically recording a variety of metrics that are published to CloudWatch:
Invocations Metrics: Display the results of Lambda function invocations, such as the number of times our function runs (both successful and error runs). Errors include exceptions thrown by our code or the Lambda runtime (such as timeouts or throttles).
Performance Metrics: Display performance details, such as the duration time in milliseconds.
Concurrency Metrics: These include metrics like concurrent executions, which represent the total number of instances processing events across the function.
Asynchronous Invocation Metrics: These metrics help track the number of asynchronous events queued for processing, the duration an event has been waiting to be processed, and any events that have been dropped.
In the Monitor tab of our Lambda function, we can view all of these metrics:
So, what if we want to add a custom metric related to our application's domain? Run the following command to add a new NuGet package:
dotnet add src/MyAPI package AWS.Lambda.Powertools.Metrics
Update the Register method in the Function.cs file as follows:
[Logging]
[Metrics]
public async Task<APIGatewayHttpApiV2ProxyResponse> Register(APIGatewayHttpApiV2ProxyRequest input, ILambdaContext context)
{
    var request = JsonSerializer.Deserialize<RegisterTaskRequest>(input.Body)!;
    var taskId = Guid.NewGuid();
    var worker = await GetWorker();
    var putItemRequest = new PutItemRequest
    {
        TableName = _tableName,
        Item = new Dictionary<string, AttributeValue> {
                {
                    "id",
                    new AttributeValue {
                    S = taskId.ToString(),
                    }
                },
                {
                    "description",
                    new AttributeValue {
                    S = request.Description
                    }
                },
                {
                    "worker",
                    new AttributeValue {
                    S = worker
                    }
                }
            }
    };
    Logger.LogInformation("Task {TaskId} assigned to {Worker}", new[] { taskId.ToString(), worker });
    await _dynamoDBClient.PutItemAsync(putItemRequest);
    var body = JsonSerializer.Serialize(new RegisterTaskResponse(taskId));
    var @event = new PublishRequest
    {
        TopicArn = _topicArn,
        Message = JsonSerializer.Serialize(new TaskRegistered(taskId, request.Description, worker)),
    };
    await _snsClient.PublishAsync(@event);
    Metrics.AddMetric("Tasks", 1, MetricUnit.Count);
    return new APIGatewayHttpApiV2ProxyResponse
    {
        Body = body,
        StatusCode = 200,
        Headers = new Dictionary<string, string> { { "Content-Type", "application/json" } }
    };
}
We decorated the method with the Metrics attribute and added the metric sending before returning the response. Additionally, update the global section of the template.yaml file as follows:
Globals:
  Function:
    Timeout: 30
    MemorySize: 512
    Architectures:
      - x86_64
    Environment:
      Variables:
        POWERTOOLS_SERVICE_NAME: MyApi
        POWERTOOLS_LOG_LEVEL: Information
        POWERTOOLS_LOGGER_CASE: CamelCase
        POWERTOOLS_METRICS_NAMESPACE: MyApi
        TABLE_NAME:
          Ref: DynamoTable
        TOPIC_ARN:
          Ref: SNSTopic
        URL: "https://api.namefake.com/"
We have added the namespace that will contain our metric. Deploy the application and navigate to CloudWatch to view our metric:
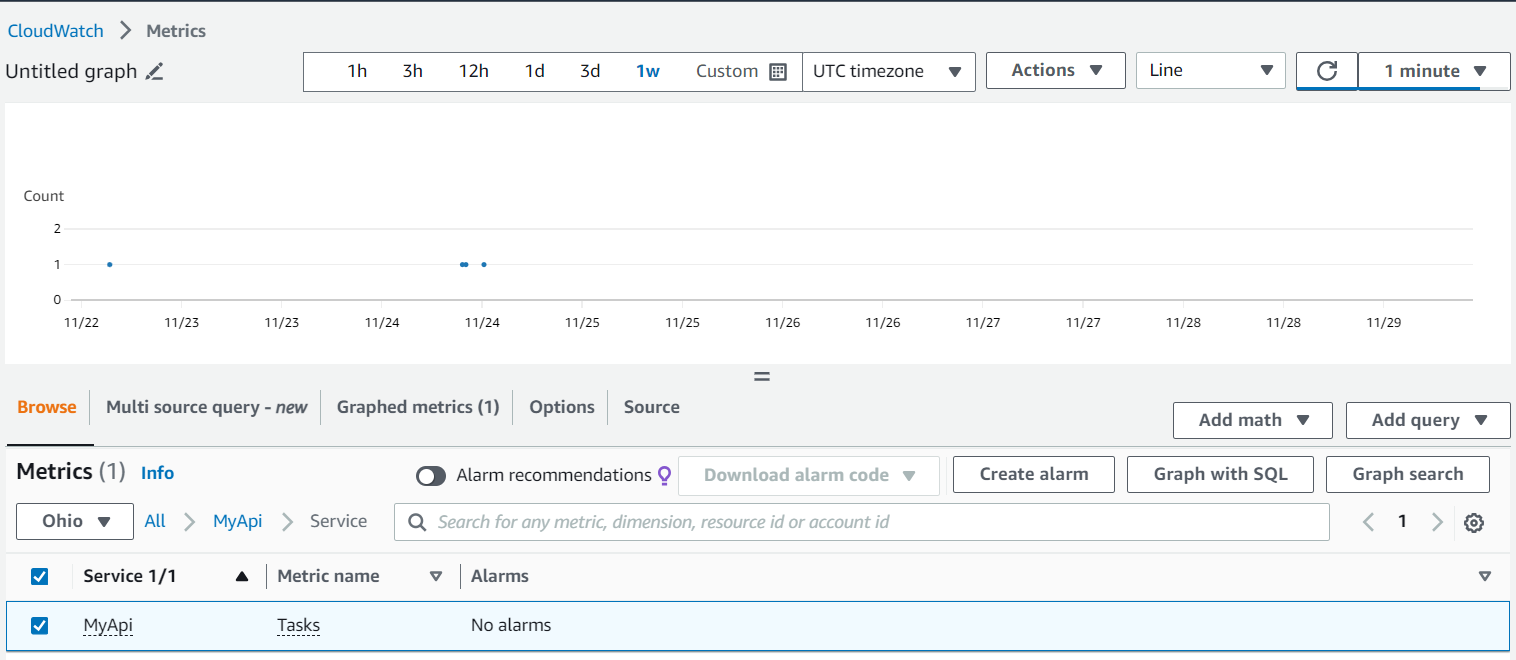
For more information, refer to the official documentation here.
Traces
While observing individual Lambda functions can be useful, most serverless applications are composed of multiple services working together. To identify performance issues or errors, you may need to trace a transaction from the source caller through several downstream services. AWS X-Ray is the tool we can use to accomplish this.
AWS X-Ray is a service that collects data about requests that your application serves, and provides tools that you can use to view, filter, and gain insights into that data to identify issues and opportunities for optimization
Let's see how easy it is to add AWS X-Ray to Lambda functions. Run the following command to add a new NuGet package:
dotnet add src/MyAPI package AWS.Lambda.Powertools.Tracing
dotnet add src/MyAPI package AWSXRayRecorder
Update the Function.cs file as follows:
public partial class Function
{
    private readonly AmazonDynamoDBClient _dynamoDBClient;
    private readonly string _tableName;
    private readonly AmazonSimpleNotificationServiceClient _snsClient;
    private readonly string _topicArn;
    private readonly HttpClient _httpClient;
    private readonly string _url;
    public Function()
    {
        Tracing.RegisterForAllServices();
        _dynamoDBClient = new AmazonDynamoDBClient();
        _tableName = Environment.GetEnvironmentVariable("TABLE_NAME")!;
        _snsClient = new AmazonSimpleNotificationServiceClient();
        _topicArn = Environment.GetEnvironmentVariable("TOPIC_ARN")!;
        _httpClient = new HttpClient(new HttpClientXRaySanitizedTracingHandler(new HttpClientHandler()));
        _url = Environment.GetEnvironmentVariable("URL")!;
    }

    [Logging]
    [Metrics]
    [Tracing]
    public async Task<APIGatewayHttpApiV2ProxyResponse> Register(APIGatewayHttpApiV2ProxyRequest input, ILambdaContext context)
    {
        var request = JsonSerializer.Deserialize<RegisterTaskRequest>(input.Body)!;
        var taskId = Guid.NewGuid();
        var worker = await GetWorker();
        var putItemRequest = new PutItemRequest
        {
            TableName = _tableName,
            Item = new Dictionary<string, AttributeValue> {
                    {
                        "id",
                        new AttributeValue {
                        S = taskId.ToString(),
                        }
                    },
                    {
                        "description",
                        new AttributeValue {
                        S = request.Description
                        }
                    },
                    {
                        "worker",
                        new AttributeValue {
                        S = worker
                        }
                    }
                }
        };
        Logger.LogInformation("Task {TaskId} assigned to {Worker}", new[] { taskId.ToString(), worker });
        await _dynamoDBClient.PutItemAsync(putItemRequest);
        var body = JsonSerializer.Serialize(new RegisterTaskResponse(taskId));
        var @event = new PublishRequest
        {
            TopicArn = _topicArn,
            Message = JsonSerializer.Serialize(new TaskRegistered(taskId, request.Description, worker)),
        };
        await _snsClient.PublishAsync(@event);
        Metrics.AddMetric("Tasks", 1, MetricUnit.Count);
        return new APIGatewayHttpApiV2ProxyResponse
        {
            Body = body,
            StatusCode = 200,
            Headers = new Dictionary<string, string> { { "Content-Type", "application/json" } }
        };
    }

    [Tracing]
    private async Task<string> GetWorker()
    {
        var response = await _httpClient.GetAsync(_url);
        if (response.StatusCode != System.Net.HttpStatusCode.OK)
        {
            return "Missing worker";
        }
        var content = await response.Content.ReadAsStringAsync();
        var payload = JsonSerializer.Deserialize<Payload>(content);
        return payload?.Name ?? "Missing worker";
    }

    public async Task<APIGatewayHttpApiV2ProxyResponse> Get(APIGatewayHttpApiV2ProxyRequest input, ILambdaContext context)
    {
        var id = input.PathParameters["id"];
        var request = new GetItemRequest
        {
            TableName = _tableName,
            Key = new Dictionary<string, AttributeValue>() { { "id", new AttributeValue { S = id.ToString() } } },
        };

        var response = await _dynamoDBClient.GetItemAsync(request);
        if (response.HttpStatusCode != System.Net.HttpStatusCode.OK)
        {
            return new APIGatewayHttpApiV2ProxyResponse
            {
                StatusCode = 404
            };
        }
        var body = JsonSerializer.Serialize(new GetTaskResponse(Guid.Parse(response.Item["id"].S), response.Item["description"].S, response.Item["worker"].S));
        return new APIGatewayHttpApiV2ProxyResponse
        {
            Body = body,
            StatusCode = 200,
            Headers = new Dictionary<string, string> { { "Content-Type", "application/json" } }
        };
    }
}
At the constructor level, we added Tracing.RegisterForAllServices() to instrument all our AWS SDK clients. Apart from that, we use the delegating class HttpClientXRaySanitizedTracingHandler to instrument our HTTP calls. The Register and GetWorker methods were decorated with the Tracing attribute to capture the traces. Additionally, update the global section of the template.yaml file as follows:
Globals:
  Api:
    TracingEnabled: true

  Function:
    Timeout: 30
    MemorySize: 512
    Tracing: Active
    Architectures:
      - x86_64
    Environment:
      Variables:
        POWERTOOLS_SERVICE_NAME: MyApi
        POWERTOOLS_LOG_LEVEL: Information
        POWERTOOLS_LOGGER_CASE: CamelCase
        POWERTOOLS_LOGGER_LOG_EVENT: true
        POWERTOOLS_METRICS_NAMESPACE: MyApi
        TABLE_NAME:
          Ref: DynamoTable
        TOPIC_ARN:
          Ref: SNSTopic
        URL: "https://api.namefake.com/"
To enable tracing we used the Tracing property for Lambda function and TracingEnabled for the API Gateway. Deploy the application, navigate to the Monitor tab, scroll to the bottom, and open a trace:
For more information, refer to the official documentation here.
In conclusion, observability is crucial for identifying and resolving issues in serverless architectures. By implementing the three pillars of observability - logging, metrics, and traces - using PowerTools for AWS Lambda, developers can efficiently monitor and troubleshoot their applications. The final code can be found here. Thanks, and happy coding.