Diagnostic .NET Apps using dotnet-monitor

Somebody who likes to code
In production environments, collecting diagnostics such as traces, logs, metrics, and dumps can be challenging. Typically, one must access the environment, install some tools, and then gather the information. dotnet-monitor simplifies and unifies the way of collecting diagnostic information by exposing a REST API, regardless of where your application is being executed (on your local machine, an on-premises server, or within a Kubernetes cluster). Depending on our needs, dotnet-monitor could serve as a replacement for other .NET diagnostic tools, such as dotnet-counters, dotnet-dump, dotnet-gcdump, and dotnet-trace, particularly in the context of information collection.
Setup
We can install dotnet-monitor as a global tool using the following command:
dotnet tool install --global dotnet-monitor --version 8.0.0-rc.2.23502.11
Once installed, we can start dotnet-monitor via the following command:
dotnet monitor collect --no-auth
dotnet-monitor includes the Swagger UI for exploring the API surface under https://localhost:52323. To test the tool, we will use a standard .NET application. Run the following commands:
dotnet new web -o DotNetMonitorSandBox
dotnet new sln -n DotNetMonitorSandbox
dotnet sln add --in-root DotNetMonitorSandBox
Processes
The Processes API lists the processes that dotnet-monitor can detect and obtain their metadata. Open your browser and navigate to https://localhost:52323/processes to list the available processes (make sure you have run our sample application):
[
  {
    "pid": 19828,
    "uid": "66140161-2208-4e7c-b874-79aa037d4344",
    "name": "dotnet",
    "isDefault": false
  },
  {
    "pid": 57388,
    "uid": "2b0aba55-1579-41a5-b6a7-c1575650352a",
    "name": "DotNetMonitorSandBox",
    "isDefault": false
  }
]
The pid property represents the ID of the process. The uid property is useful for uniquely identifying a process when it's running in an environment where the process ID may not be unique (for instance, multiple containers within a Kubernetes pod will have entry point processes with process ID 1). Navigate to https://localhost:52323/process?pid={pid} to see more information or https://localhost:52323/env?pid={pid} to get the environment variables of the specified process.
Logs
The Logs API enables collecting logs that are logged to the ILogger<> infrastructure. Open the Program.cs file and update the content as follows:
var builder = WebApplication.CreateBuilder(args);
var app = builder.Build();
app.MapGet("/", () =>
{
    app.Logger.LogInformation("Hello World!");
    return "Hello World!";
});

app.Run();
Run the application and navigate to https://localhost:52323/logs?pid={pid}&durationSeconds=60 to stream (it may take some time to start) our log statements during the next 60 seconds.
Traces
The Traces API enables collecting .nettrace formatted traces. To capture the traces of a process using a predefined set of trace profiles (Cpu, Http, Logs, Metrics), navigate to https://localhost:52323/trace?pid={pid}&durationSeconds=60 and wait to get the file. Open the Program.cs file and update the content as follows:
using System.Diagnostics.Tracing;

var builder = WebApplication.CreateBuilder(args);
var app = builder.Build();
app.MapGet("/", () =>
{
    app.Logger.LogInformation("Hello World!");
    MyEventSource.Log.Request("Hello World!");
    return "Hello World!";
});

app.Run();

[EventSource(Name = "MyEventSource")]
public sealed class MyEventSource : EventSource
{
    public static MyEventSource Log { get; } = new MyEventSource();

    [Event(1, Level = EventLevel.Informational)]
    public void Request(string message)
    {
        WriteEvent(1, message);
    }
}
To capture the traces of a custom event provider, we need to make a POST call to the same endpoint using the following request body:
{
    "Providers": [{
        "Name": "MyEventSource",
        "EventLevel": "Informational"
    }],
    "BufferSizeInMB": 1024
}
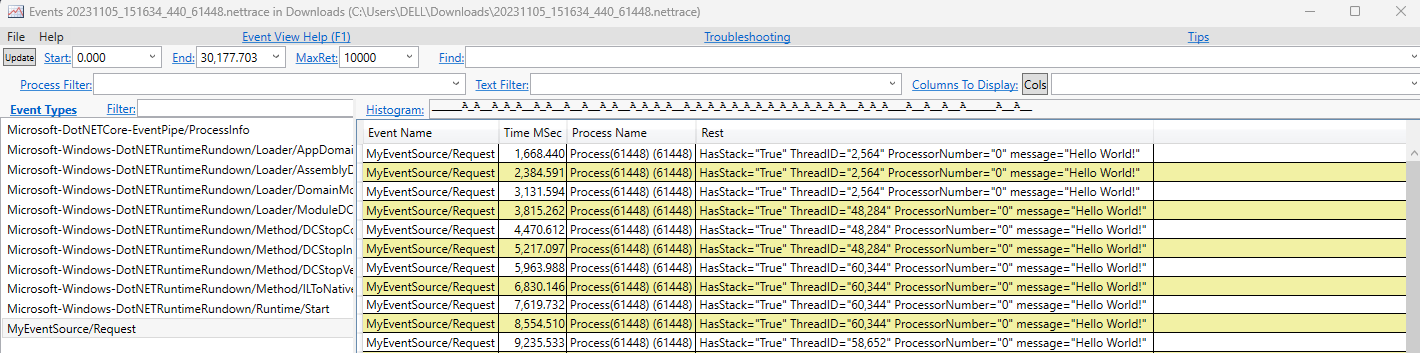
On Windows, .nettrace files can be viewed in PerfView for analysis or in Visual Studio:
Metrics
The Metrics API gets a snapshot of metrics in the Prometheus exposition format of a single process (the pid will be set through configuration). dotnet-monitor can read and combine configurations from multiple sources. The file settings path for Windows is %USERPROFILE%\.dotnet-monitor\settings.json. So, let's update the file with the following content (or create it if it's not present):
{
  "DefaultProcess": {
    "Filters": [{
      "Key": "ProcessId",
      "Value": "<pid>"
    }]
  },
}
The configuration will be automatically loaded by dotnet-monitor. The metrics collected are from the following providers by default:
System.RuntimeMicrosoft.AspNetCore.HostingGrpc.AspNetCore.Server
Navigate to https://localhost:52323/metrics to see an output similar to:
# HELP systemruntime_cpu_usage_ratio CPU Usage
# TYPE systemruntime_cpu_usage_ratio gauge
systemruntime_cpu_usage_ratio 0 1699198374885
systemruntime_cpu_usage_ratio 0 1699198379898
systemruntime_cpu_usage_ratio 0 1699201002325
# HELP systemruntime_working_set_bytes Working Set
# TYPE systemruntime_working_set_bytes gauge
systemruntime_working_set_bytes 63393792 1699198364894
systemruntime_working_set_bytes 63401984 1699198369888
systemruntime_working_set_bytes 63418368 1699198374885
# HELP systemruntime_gc_heap_size_bytes GC Heap Size
# TYPE systemruntime_gc_heap_size_bytes gauge
systemruntime_gc_heap_size_bytes 7085504 1699198364894
systemruntime_gc_heap_size_bytes 7093696 1699198369888
systemruntime_gc_heap_size_bytes 7110080 1699198374885
dotnet-monitor works with both System.Diagnostics.Metrics (.NET 8 Apps) based APIs and EventCounters (you can see the difference between the metrics APIs here). As we are using a .NET 7, we will modify the Program.cs file as follows:
using System.Diagnostics.Tracing;

var builder = WebApplication.CreateBuilder(args);
var app = builder.Build();
app.MapGet("/", () =>
{
    app.Logger.LogInformation("Hello World!");
    MyEventSource.Log.Request("Hello World!");
    return "Hello World!";
});

app.Run();

[EventSource(Name = "MyEventSource")]
public sealed class MyEventSource : EventSource
{
    public static MyEventSource Log { get; } = new MyEventSource();

    private EventCounter _counter;

    public MyEventSource()
    {
        _counter = new EventCounter("my-custom-counter", this)
        {
            DisplayName = "my-custom-counter",
            DisplayUnits = "ms"
        };
    }

    [Event(1, Level = EventLevel.Informational)]
    public void Request(string message)
    {
        WriteEvent(1, message);
        _counter.WriteMetric(1);
    }
}
To capture the metrics of a custom event provider, we need to modify the settings.json file as follows:
{
  "Metrics": {
    "Providers": [
      {
        "ProviderName": "MyEventSource",
        "CounterNames": [
          "my-custom-counter"
        ]
      }
    ]
  },
  "DefaultProcess": {
    "Filters": [{
      "Key": "ProcessId",
      "Value": "<pid>"
    }]
  },
}
Live Metrics
The Live Metrics API captures metrics for a chosen process (the same default providers listed in the metrics section). Navigate to https://localhost:52323/livemetrics?pid={pid}&durationSeconds=60 and wait to get a .json file. To capture the live metrics of a custom event provider, we need to make a POST call to the same endpoint using the following request body:
{
    "includeDefaultProviders": false,
    "providers": [
        {
            "providerName": "MyEventSource",
            "counterNames": [
                "my-custom-counter"
            ]
        }
    ]
}
The output will resemble the following:
{"timestamp":"2023-11-05T18:52:32.5333078-05:00","provider":"MyEventSource","name":"my-custom-counter","displayName":"my-custom-counter","unit":"ms","counterType":"Metric","tags":"","value":1}
{"timestamp":"2023-11-05T18:52:37.5321623-05:00","provider":"MyEventSource","name":"my-custom-counter","displayName":"my-custom-counter","unit":"ms","counterType":"Metric","tags":"","value":1}
{"timestamp":"2023-11-05T18:52:42.5360839-05:00","provider":"MyEventSource","name":"my-custom-counter","displayName":"my-custom-counter","unit":"ms","counterType":"Metric","tags":"","value":1}
{"timestamp":"2023-11-05T18:52:47.5309596-05:00","provider":"MyEventSource","name":"my-custom-counter","displayName":"my-custom-counter","unit":"ms","counterType":"Metric","tags":"","value":1}
{"timestamp":"2023-11-05T18:52:52.5323712-05:00","provider":"MyEventSource","name":"my-custom-counter","displayName":"my-custom-counter","unit":"ms","counterType":"Metric","tags":"","value":1}
{"timestamp":"2023-11-05T18:52:57.5310386-05:00","provider":"MyEventSource","name":"my-custom-counter","displayName":"my-custom-counter","unit":"ms","counterType":"Metric","tags":"","value":1}
Dump
The Dump API captures a managed dump of a specified process without using a debugger. Navigate to https://localhost:52323/dump?pid={pid}&durationSeconds=60 and wait to get a .dmp file (the app is suspended while the dump is being collected). The dump files can be analyzed using tools such as dotnet-dump or Visual Studio. A dump file cannot be analyzed on a machine of a different OS/Architecture than where it was captured.
GCDump
The GCDump API captures a GC dump of a specified process. Navigate to https://localhost:52323/gcdump?pid={pid}&durationSeconds=60 and wait to get a .gcdump file. Apart from Visual Studio, we can use PerfView to analyze the gcdump file and dotnet-gcdump to generate reports. Unlike a dump file, a gcdump file is a portable format that can be analyzed regardless of the platform it was collected.
We hope that this article serves as an introduction and encourages you to utilize this fantastic tool. All the code is available here. Thanks, and happy coding.