Diagnostic .NET Apps in Kubernetes with dotnet-monitor
Somebody who likes to code
Today, we will review one of the most common dotnet-monitor use cases: running as a side card in a Kubernetes cluster. We recommend having some background in Kubernetes and reviewing our previous articles if you haven't already done so:
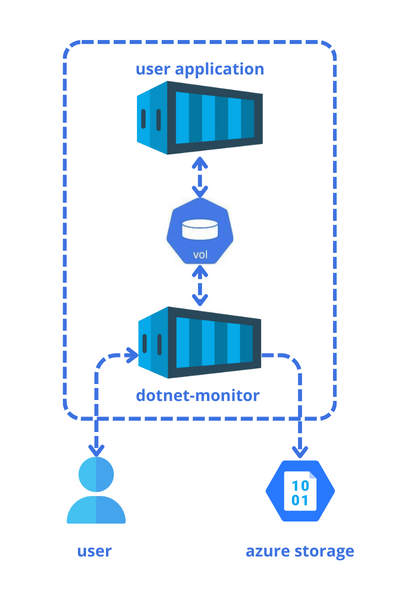
In the image above, we are displaying a pod with two containers: one is the application we want to monitor, and the other is the dotnet-monitor. Both are using a shared volume for communication. To get diagnostic data, a user can access the dotnet-monitor API container through port forwarding or set up collection rules to upload the artifact to external storage.
Pre-requisites
Install Docker Desktop
Enable Kubernetes (the standalone version included in Docker Desktop)
Ensure you have an Azure Account
Install Azure CLI
Download the example code.
Storage
Log into Azure by running az login, and create a storage account and container using the following commands:
az group create -l eastus -n MyResourceGroup
az storage account create --name 24f12674a14143d --resource-group MyResourceGroup --location eastus --sku Standard_ZRS --encryption-services blob
$assignee = az ad signed-in-user show --query objectId -o tsv
az role assignment create --role "Storage Blob Data Contributor" --assignee $assignee --scope "/subscriptions/e759b3f9-6ac3-4f9d-b479-1ba4471235cd/resourceGroups/MyResourceGroup/providers/Microsoft.Storage/storageAccounts/24f12674a14143d"
az storage container create --account-name 24f12674a14143d --name mycontainer --auth-mode login
Obtain the account keys by executing the following command:
az storage account keys list -g MyResourceGroup -n 24f12674a14143d
Container Image
At the project level, we need a Dockerfile to containerize our application. It should include the following content:
FROM mcr.microsoft.com/dotnet/aspnet:6.0 AS base
WORKDIR /app

FROM mcr.microsoft.com/dotnet/sdk:6.0 AS build
COPY ["DotNetMonitorSandBox/DotNetMonitorSandBox.csproj", "DotNetMonitorSandBox/"]
RUN dotnet restore "DotNetMonitorSandBox/DotNetMonitorSandBox.csproj"
COPY . .
WORKDIR "/DotNetMonitorSandBox"
RUN dotnet build "DotNetMonitorSandBox.csproj" -c Release -o /app/build

FROM build AS publish
RUN dotnet publish "DotNetMonitorSandBox.csproj" -c Release -o /app/publish

FROM base AS final
WORKDIR /app
COPY --from=publish /app/publish .
ENTRYPOINT ["dotnet", "DotNetMonitorSandBox.dll"]
At the solution level, execute the following command to create the container image:
docker build -t raulnq/dotnetmonitorsandbox:1.0 -f .\DotNetMonitorSandBox\Dockerfile .
Configuration
We will configure dotnet-monitor using a JSON file, which will be mounted in the pod from a config map. The configmap.yaml file will contain the following content:
apiVersion: v1
kind: ConfigMap
metadata:
  name: dotnet-monitor-configmap
data:
  settings.json: |
    {
      "Egress": {
        "AzureBlobStorage": {
          "monitorBlob": {
            "accountUri": "https://24f12674a14143d.blob.core.windows.net/",
            "containerName": "mycontainer",
            "blobPrefix": "artifacts",
          "accountKey": "{account-key}"
          }
        }
      },
      "DiagnosticPort": {
        "ConnectionMode": "Listen",
        "EndpointName": "/diag/dotnet-monitor.sock"
      },
      "CollectionRules": {
        "LargeGCHeapSize": {
          "Trigger": {
            "Type": "EventCounter",
            "Settings": {
              "ProviderName": "System.Runtime",
              "CounterName": "gc-heap-size",
              "GreaterThan": 10
            }
          },
          "Actions": [
            {
              "Type": "CollectGCDump",
              "Settings": {
                "Egress": "monitorBlob"
              }
            }
          ],
          "Limits": {
            "ActionCount": 2,
            "ActionCountSlidingWindowDuration": "1:00:00"
          }
        }
      }
    }
In the JSON content, there are three sections of interest (refer to previous articles for details):
Egress: In this section, we define the target Azure Blob Storage to which the diagnostic artifacts will be sent.DiagnosticPort: We use thelistenmode and define the Unix Domain Socket used by thedotnet-monitor.CollectionRules: In this section, a rule is defined to collect a GCDump when the size of the heap exceeds 10MB.
Deployment
The next step involves defining a deployment.yaml file as follows:
apiVersion: apps/v1
kind: Deployment
metadata:
  name: dotnet-monitor-deployment
spec:
  replicas: 1
  selector:
    matchLabels:
      app: dotnet-monitor-app
  template:
    metadata:
      labels:
        app: dotnet-monitor-app
    spec:
      restartPolicy: Always
      containers:
      - name: app
        image: raulnq/dotnetmonitorsandbox:1.0
        imagePullPolicy: IfNotPresent
        env:
        - name: DOTNET_DiagnosticPorts
          value: /diag/dotnet-monitor.sock,suspend
        volumeMounts:
        - mountPath: /diag
          name: diagvol
        resources:
          requests:
            cpu: 250m
            memory: 512Mi
          limits:
            cpu: 250m
            memory: 512Mi
      - name: monitor
        image: mcr.microsoft.com/dotnet/monitor:8
        args: [ "collect", "--no-auth" ]
        imagePullPolicy: IfNotPresent
        env:
        - name: DOTNETMONITOR_Urls
          value: http://localhost:52323
        volumeMounts:
        - mountPath: /diag
          name: diagvol
        - mountPath: /etc/dotnet-monitor/settings.json
          name: configvol
          subPath: settings.json
        resources:
          requests:
            cpu: 50m
            memory: 32Mi
          limits:
            cpu: 250m
            memory: 256Mi
      volumes:
      - name: diagvol
        emptyDir: {}
      - name: configvol
        configMap:
          name: dotnet-monitor-configmap
The deployment above consists of a couple of volumes and two containers:
volumesdiagvol: AnemptyDirvolume provides an empty directory that containers in the pod can read from and write to.configvol: We can add files to a config map and mount them into a container.
containersapp: Our primary application, in which we establish an environment variable that corresponds to the diagnostic port utilized bydotnet-monitor. In addition to this, we are mounting theemptyDirvolume that will be used for communication with the monitor container.monitor: In this container, we are mounting the sameemptyDirvolume and the setting file.
Run the following commands to deploy our application to the Kubernetes cluster:
kubectl apply -f .\configmap.yaml
kubectl apply -f .\deployment.yaml
To test dotnet-monitor, we will perform port forwarding for the main application. First, execute the command kubectl get pods to obtain the pod name, and then proceed with the following command:
kubectl port-forward {pod-name} 8081:80
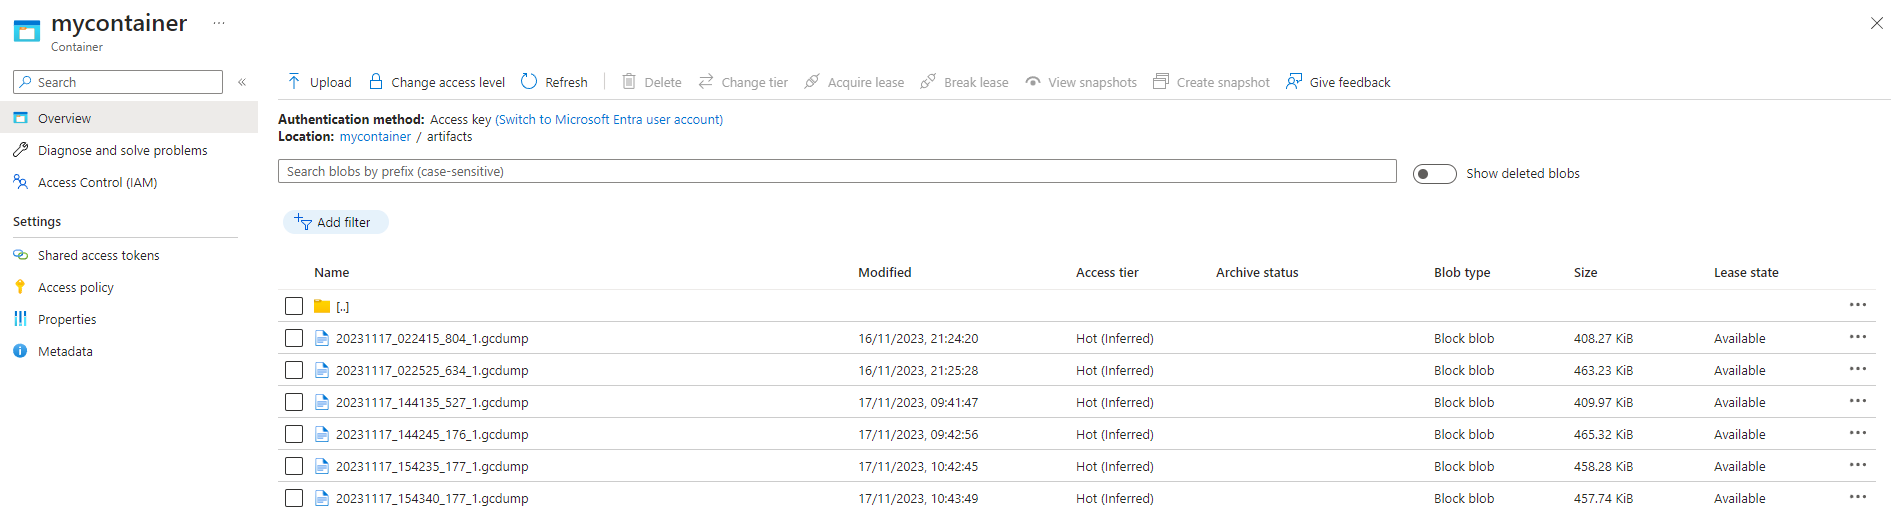
We will simulate a memory leak by repeatedly accessing the endpoint http://localhost:8081/memory-leak. Over time, we will begin to see GC dumps appear in our Azure Blob Storage.
In conclusion, using dotnet-monitor as a sidecar in Kubernetes enables efficient diagnostics and monitoring of .NET applications, simplifying the process of collecting diagnostic data in a containerized environment. Thank you, and happy coding.